

Population information is vitally important for the government when it comes to the allotment of funds to different districts. It also helps to show trends in demography across the nation, especially amongst different ethnicities.
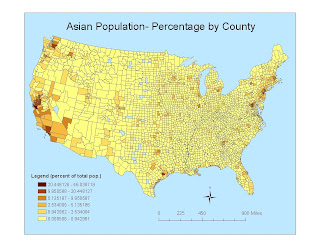
In the United States, the percentage of Asian people in the entire population ranges from less than 1%-46%. Their group has a significant presence in the West, and to an even greater degree of detail, they're main location is in coastal locales, with little to no points appearing in the South or East. The primary location of the highest percentage of this race can be seen in California, specifically the San Francicso Bay area and the Los Angeles County region. Some small numbers can be seen in Florida and the very edge of the Northeast, states like New York or Massachusetts, but it seems as though areas with the high percentages for this ethnic group are very few and mainly found in California or Washington.
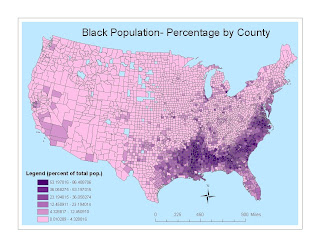
A map of the black population shows similarities to that of the asian group, but there are striking differences as well. While the black group has a significant showing in Southern California, its presence in the South is much more substantial than the previous ethnic group. And, as a percentage of a total population, they have a much higher scale, ranging from less than 1%-87%. Their group's range covers most everything to the east of the Mississippi River line, and their concentration is obviously much greater, since their highest percentile is almost twice as much as the asian populaiton's. They too do not have a prominence in the Midwest, nor do they have a large spread in the nation's North, but their numbers in general show a farther reach across the United States than either of the other two groups.
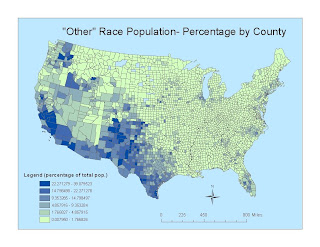
The last category, "some other race alone," is vague in its coverage, but helps to fill in a bit where the two previous groups lacked in residence. This group has prominence in the West, but with a greater overall span than the asian population. The numbers span from less than 1%-39%, with a prominent showing in the western United States. From the south of Texas to the north of Washington, this group's highest three percentage intervals are heavily evidenced. New Mexico, California and Texas are the main sites for residence, as evinced by the darker polygons (ie, higher population concentrations) in their boundaries. They follow the trend of the prior two demographic maps, with sparse groupings on the East Coast, and barely noticeable sightings in the Midwestern region.
These three thematic maps, in essence, cover the overwhelming majority of the United States population. Their large numbers and high concentrations, however, have specific locations and are situated in sprawling areas that overlap. From North Dakota down to Oklahoma, over to Indiana, there is a noticeable void. The midwest, while certainly populated, doesn't really have a place in these three maps. The relative "border land" presence of the asian, black and "other" populations could be due to historical settlement or a fairly close proximity to locations of entrance into the country, but for lack of a more concrete reason, one cannot fully explain the gap in midwestern coverage. If a more extensive mapping was done, that included all races covered in the census, our nation might be more completely colored in with population percentages, but with just these three completed, we have some locations lacking. But all in all, it is nice to see where various populations are present across the US.
Working with GIS has taught me a lot about extensive mapping, but also about the advances in technology that have made it so easy. With ArcGIS software, caluclating population densities, or pinpointing landmarks go hand in hand with land use and terrain analysis. And instead of having to manually calculate every aspect of the data, using secondary sources and pre-programmed tools simplifies the process into a short, five minute task. Prior to this class, and working with ArcGIS, my perception of mapping was limited, or rather that mapping itself was a limited endeavor. Yet every week I've come to realize not only the depth, but the wide range of mapping topics. It's impressive to see how broad GIS can be in its coverage, and how focused you can then make it once you've narrowed your topic choices. While I don't think I'm at the point of mastering the software (I still very much need some more experienced assistance), I do feel like I have a decent grasp of ArcGIS and GIS as a discipline to accomplish what small tasks I may encounter.


